Since the beginning of the 21st century, a series of events have tested the resilience of ports and maritime supply chains (figure 25). Each disruption represents an opportunity for the logistics and freight distribution system to adapt to a new reality and associated constraints. For instance, the resilience of ports and maritime supply chains was tested after the events of 11 September 2001; thereafter, security measures became a core focus as ports were considered as potentially vulnerable targets for attack. Security measures and standards were introduced across the industry, e.g. cargo scanning and advance manifest notification, resulting in increasingly secure ports. As a result, security measures and standards now form an integral part of shipping practices, and have consequently led to a substantial reduction in security concerns.
Figure 25: Main natural and anthropogenic supply chain disruptions in the 21st century
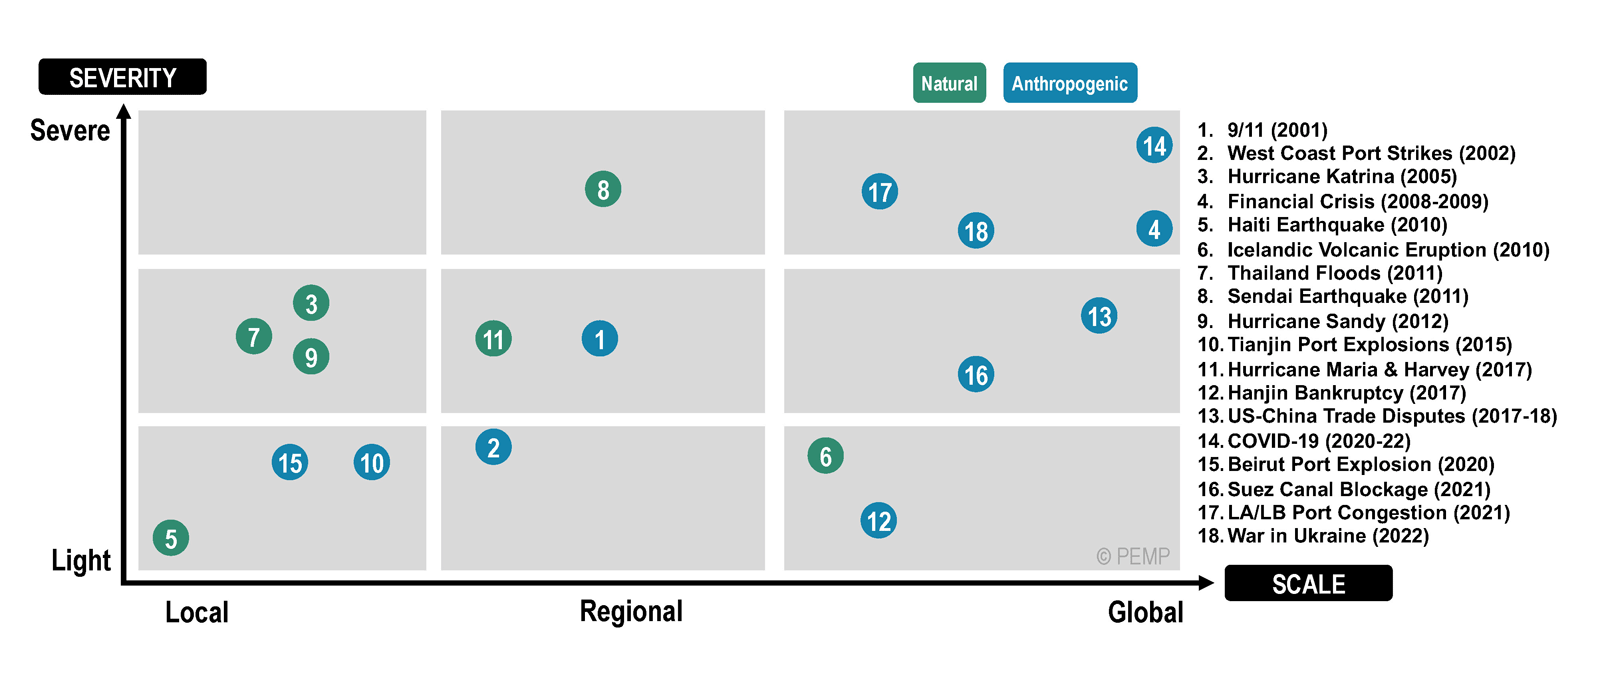
Source: Based on data from J.P. Rodrigue, Global Container Port Database.
Assessing the severity of a supply chain disruption is challenging as it can involve the price of raw materials and issues along the multimodal transport chain, e.g. strikes disrupting a port’s operations, or natural disasters disrupting manufacturing clusters. The Global Supply Chain Pressure Index (GSCPI) was developed by the Federal Reserve Bank of New York and includes 27 monthly variables reflecting events within supply chains and transportation costs in the maritime and air cargo sectors.2 The index is normalized so that zero indicates an average value, and any deviation is related to a stress level. Positive values represent how many standard deviations the index is above the average, implying that supply chains are under pressure. Negative values are shown when supply chains are functioning well and experiencing limited disruptions or pressure (figure 26).
Figure 26: Global Supply Chain Pressure Index (GSCPI) and major supply chain disruptions
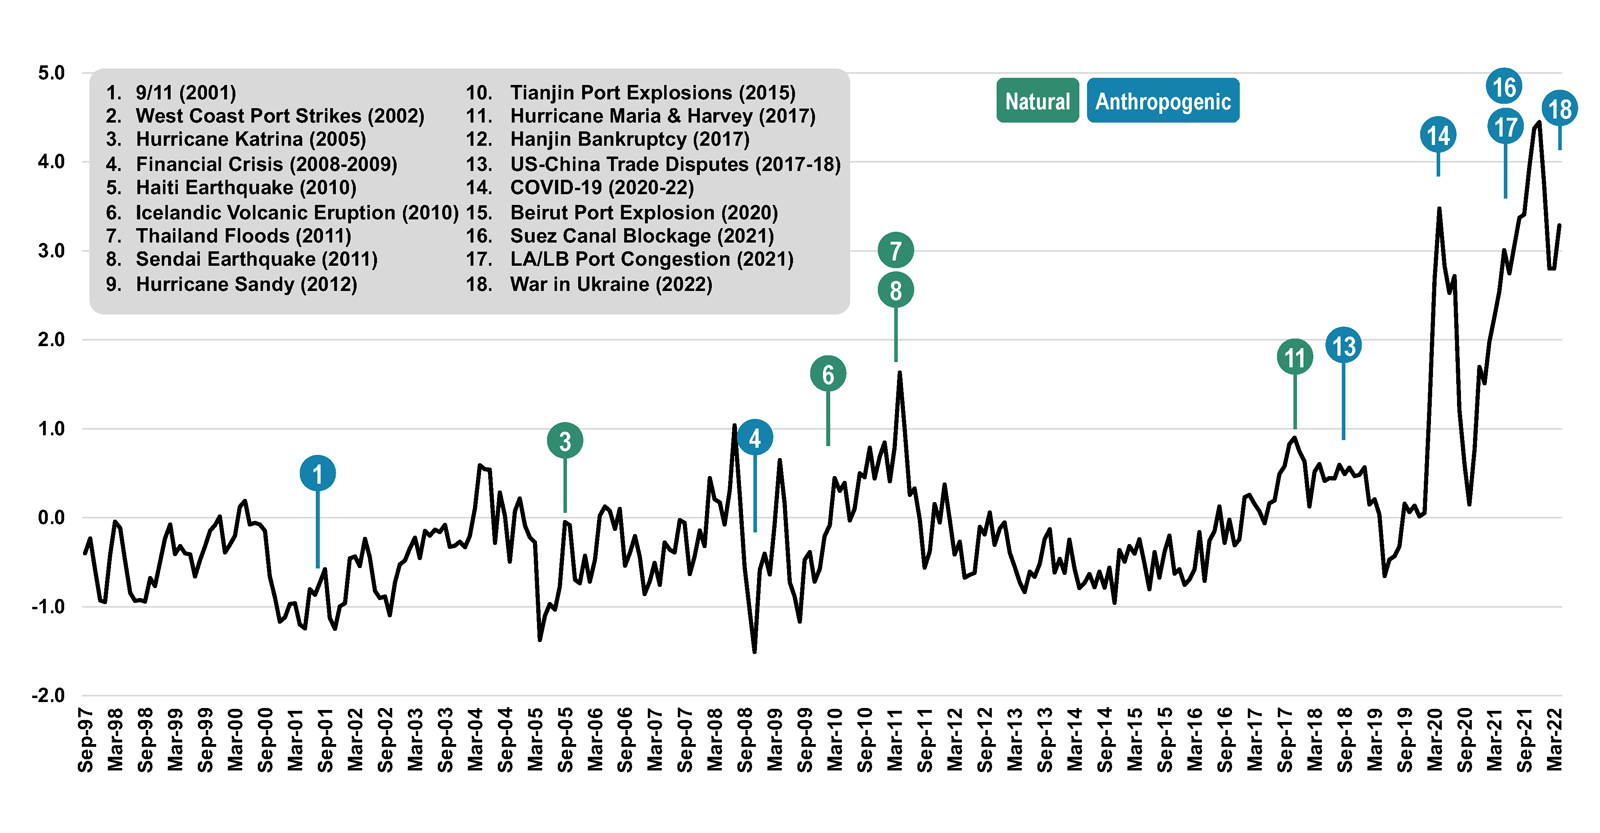
Source: Data from G. Benigno et al (2022).
The variability of the GSCPI, particularly when it surges above 0, can be associated with specific events. For instance, the index surged significantly in 2011 following the Sendai earthquake and resulting tsunami; the latter impacted Japanese car manufacturing and its exports to foreign markets. The same year, flooding around Bangkok, Thailand, disrupted global supply chains in the automotive and electronics sectors, particularly hard drives, leading to shortages among global computer manufacturers. The index rose again in 2017 and 2018 following United States-China trade disputes, inciting several large manufacturers and retailers to revise their manufacturing and procurement strategies. Some events, particularly the onset of a recession, e.g. the financial crisis of 2008-2009, can remove substantial pressure on supply chains as demand declines. A part of the resilience challenge relates to the geographic scale and complexity of maritime supply chains, where a singular event can have profound ramifications. The following sections present the most significant hazards and risk factors impacting port resilience.